Cambium NSE – Enabling the Full Local Web Management Interface (Beta)
This guide walks through installing the NSE 2.5-b2 beta firmware on an NSE 3000/4000 and switching it to the new full local web management interface — a more extensive on-device configuration and monitoring UI that also unlocks several features without a Security Plus subscription when configured this way.
Before you begin
This is a beta release with limited testing. Applying it includes a firmware update and downtime while the device reboots — don't run this on a device in a critical network.
You'll need:
An NSE 3000 or NSE 4000.
Access to the Cambium support portal's downloads section.
Admin access to the device's current web UI.
Enabling Full Local Web Management
Step 1: Download the beta firmware
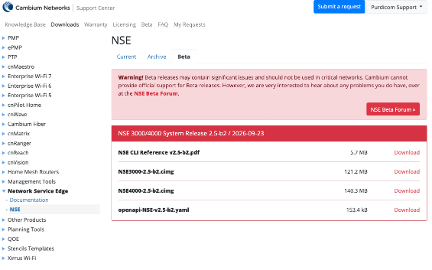
Go to the Cambium support portal's downloads page and select Network Service Edge > NSE.
Click the Beta tab, then Join Beta and accept the terms.
Under the NSE 3000/4000 beta release, download the .cimg firmware file for your device model (NSE3000 or NSE4000).
Step 2: Log in to the NSE web UI
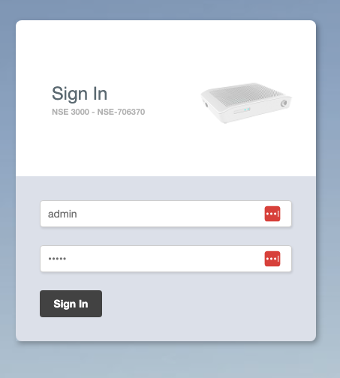
Browse to the device's management IP and sign in with the default credentials (admin / admin), or your own if you've already changed them.
Step 3: Upload and apply the firmware update
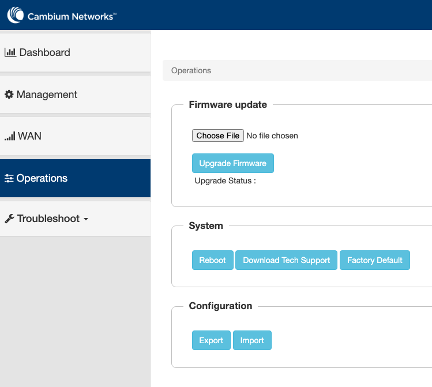
Go to Operations > Firmware Update.
Click Choose File and select the .cimg file you downloaded in Step 1.
Click Upgrade Firmware and wait for it to complete.
Reboot the device once the upgrade finishes — the new firmware isn't active until it restarts.
Step 4: Switch to the full web interface
Once the device is back up on the new firmware, log in again and go to Management, then click Switch to the full web interface under Web Interface.
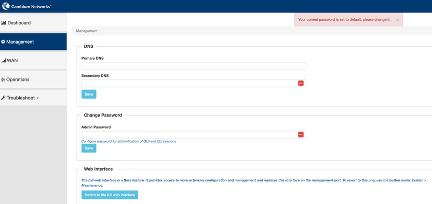
From the CLI, the equivalent is:
management full-webuiStep 5: Log back in to the new interface
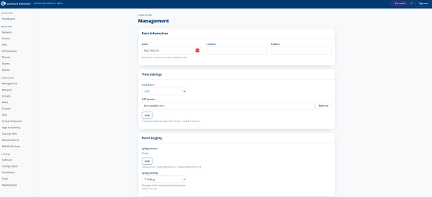
Log back in and you'll land on the new full web management UI, with the same configuration areas as before (Management, Network, Groups, WAN, Firewall, DNS, Threat Protection, High Availability, Site-Site VPN, Remote Access, RADIUS & Users) plus fuller monitoring under Dashboard, Network, Clients, VPN, Performance, and Threats.
Features this unlocks
Configured through the device UI (not cnMaestro), these no longer require a Security Plus subscription — even on devices that have never connected to cnMaestro Cloud:
High Availability
Geo-IP Firewall
Tailscale
Virtual WAN
RADIUS Proxy
The cnMaestro UI still restricts these to Security Plus subscribers, so configure them locally if you need them without that subscription.
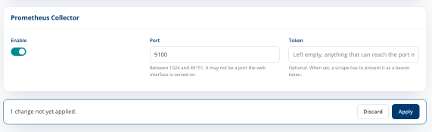
Step 6 (optional): Enable the Prometheus Collector
Expose metrics for Grafana, VictoriaMetrics, or similar tools.
Go to Management > Prometheus Collector (or run management prometheus-collector from the CLI).
Turn on Enable.
Set a Port between 1024 and 49151 — it can't be the same port the web interface is served on.
Optionally set a Token; if set, a scrape has to present it as a bearer token.
Click Apply.